POL Politiek
Discussies en diepgaande gesprekken over de politiek in de breedste zin van het woord kun je hier voeren.


Het nationaal product is hetzelfde als een taart waar uiteraard iedereen recht op heeft, als overheden met geld smijten heet het investeren en als bedrijven investeren heet het een sprinkhanenplaag. McCarthy
Een jongetje dat wordt geboren in San Marino heeft een hogere levensverwachting dan mannen in welk ander land ook: 80 jaar. Vrouwen worden met 86 gemiddeld het oudst in Japan.
Dat blijkt uit cijfers die de Wereldgezondheidsorganisatie vrijdag heeft gepresenteerd. Mannen in Sierra Leone hebben volgens de WHO de laagste levensverwachting: 37. Zo oud wordt ook de gemiddelde vrouw in Swaziland.
Voor baby’s is Afghanistan het zwaarste land om te overleven. Van de duizend kinderen die daar levend worden geboren overlijden er 165 binnen een jaar. In Singapore en IJsland gebeurt dat slechts met twee van elke duizend baby’s.
Moeders hebben het vooral zwaar in Sierra Leone. Daar overlijden tweeduizend van elke honderdduizend vrouwen die een kind ter wereld brengen. In Ierland valt dat lot slechts vier op de honderdduizend vrouwen ten deel.
De cijfers zijn gebaseerd op gegevens uit 2005.
http://www.volkskrant.nl/(...)_San_Marino_en_Japan
[ Bericht 6% gewijzigd door sigme op 19-05-2007 05:14:31 ]
ik moet verrassend weinig
Es ist heute schlecht und wird nun täglich schlechter werden, – bis das Schlimmste kommt
Es ist heute schlecht und wird nun täglich schlechter werden, – bis das Schlimmste kommt

Het nationaal product is hetzelfde als een taart waar uiteraard iedereen recht op heeft, als overheden met geld smijten heet het investeren en als bedrijven investeren heet het een sprinkhanenplaag. McCarthy

speciaal voor McCarthy, een artikel uit het Cato Institute:
Immigrants: Too Much of a Burden?
By Daniel T. Griswold | Friday, June 22, 2007
As the U.S. Congress and the Bush Administration haggle over immigration reform, the issue has become a subject of contentious debate among the U.S. public. As Daniel Griswold argues, the negative impacts of immigrants to taxpayers and society as a whole are grossly exaggerated — while their numerous positive effects are frequently overlooked.


"I think I'm in a tragedy"
[youtube]http://www.youtube.com/watch?v=FZFG5PKw504[/youtube]
"In America today profit is privatized but risk is increasingly socialized"
[youtube]http://www.youtube.com/watch?v=FZFG5PKw504[/youtube]
"In America today profit is privatized but risk is increasingly socialized"
http://www.theglobalist.com/StoryId.aspx?StoryId=5961quote:Population Forecast for the Next 15,000 Days
By Joseph Chamie | Monday, July 09, 2007
Currently at 6.7 billion, the world population continues to increase. The more populous areas are getting bigger, while migration to the west has increased populations there as well. What does an increasing population mean for all of us? Joseph Chamie analyzes the population forecasts for the year 2050.
The overall forecast for tonight and the next 15,000 days — up to the year 2050 — is for persistent demographic accumulation, especially in urban areas in the global south, declining levels of reproduction, widespread aging, continuing broad bands of migration streams and scattered mortality disturbances.
Turning to the details, the world is now at an all-time high of 6.7 billion people. The six billion mark was set in 1999, only 12 years after the earlier high of five billion in 1987. The current level of accumulation is 78 million people per year.
Unequal distribution
This is lower than the record annual high of 89 million set in the late 1980s. The seven billion mark is expected to be reached in about 1,500 days, in 2011. The current global forecast for mid-century is about nine billion people, but also possible is a high of 11 billion — or a low of eight billion.
The planet’s human population is growing at 1.2% per year, markedly lower than the all-time record high of 2.0% set back in the 1960s. A more detailed look across the map shows great variability, regionally and nationally — as well as significant demographic turbulence and instability in some areas.
Nearly all of the demographic accumulation during the coming 15,000 days — about 2.5 billion people — is expected to occur among the less-developed regions. This accumulation amounts to a 50% increase by mid-century, with some areas, especially in Africa, expected to experience even higher levels of accumulation.
More accumulation
Today, six countries — India, China, Pakistan, Nigeria, Bangladesh and Indonesia — account for half of the world’s yearly demographic accumulation. India’s annual accumulation — one-fifth of global growth — is equal to the combined totals for China, Pakistan and Nigeria.
Most of the more-developed regions, in contrast, will see little if any demographic accumulation. The population of the European continent peaked several years ago and is now declining. And many places, such as Italy, Germany, Japan and Russia, are experiencing — or will experience — demographic shortfalls.
Low fertility levels
The forecast is for Europe’s population to be 10% smaller by mid-century, with the working-age population likely experiencing a 25% decline. About the same is expected in East Asia for countries such as Japan, Singapore and the Republic of Korea.
However, areas of notable exception to these demographic shortfalls are Australia, Canada and the United States, where demographic accumulations of 30-40% are expected by the end of the forecast period, due in large part to continuing high streams of migration.
A depressed low fertility system covers close to half of the world’s population, with European countries and Japan experiencing the lowest recorded fertility levels, at 1.1 to 1.5 births per woman.
Higher life expectancy
While fertility highs remain in most of Africa and parts of Western and South Asia, these levels are falling, especially in urban areas. By the end of the 15,000-day forecast, global fertility is expected to hover around the replacement rate.
Global improvements in mortality are expected to continue, with more people reaching advanced ages. However, scattered mortality disturbances, heavy at times, will occur mainly in Africa and Asia, with isolated disturbances in Eastern Europe.
Migration patterns
A rapidly moving, high-pressure HIV/AIDS epidemic is causing a mortality tsunami, ravaging much of sub-Saharan Africa and some parts of South and East Asia.
Broad bands of migration streams, with many immigrants entering or remaining illegally, will persist and possibly intensify. The streams are moving primarily from the south in a northerly direction and also from east to west.
In addition, there will be continued migration activity within countries, with many seeking shelter in large cities, especially along the warmer seacoasts.
A widening age gap
As a result of lower fertility and longer lifespans, a widespread aging front is rapidly sweeping across the globe. This front, beginning in Europe and travelling from west to east, will result in extraordinary shifts in age structures towards elevated ages.
The numbers and proportions of elderly will likely reach historically unprecedented high levels. In many areas, one person out of three is expected to be over age 65 — and the number of persons of working age per one older person will fall sharply, from the current level of about four to two or fewer by mid-century.
More problems in the offing
These shifts in age structures will exert seismic pressures on social, economic and political conditions in all countries and areas, especially in the north. The pressures from this aging front are expected to precipitate political squalls and produce unpleasant conditions for many localities and government bodies.
It should be noted that the broad migration streams noted earlier are not expected to eliminate the pressures from the enormous and rapidly expanding aging front.
For some areas, replacement migration can offset forecasted declines in the size of overall populations — and of working-age populations. However, replacement migration cannot realistically offset population aging because the numbers involved are simply far too high.
A challenging future
The extended long-term forecast for the next 15,000 days remains unsettled. While the outlook for some areas is partly sunny and pleasant, unstable and uncomfortable conditions are expected to persist in many regions and localities.
Troubling scattered clouds are also forming on the horizon due to intensifying aging, mortality disturbances and migration streams.
http://www.theglobalist.com/StoryId.aspx?StoryId=6346quote:Squaring America's Rogue Global Image with Booming U.S. Global Earnings
By Joseph Quinlan | Saturday, January 01, 2000
Anti-Americanism has surged during the past five years, largely due to the U.S.-led war in Iraq, even as U.S. foreign affiliates have seen extraordinary profit growth. This begs an obvious question: If the world is so disapproving of the United States, why does it continue to desire and purchase U.S. goods and services?
It is a major paradox: The global image of the United States has never been lower — but the global earnings of U.S. multinationals have never been higher.
According to the latest results from the 47-nation Pew Global Attitudes Survey, anti-Americanism is more widespread than ever.
How the world views the United States
Favorable ratings of the United States fell in 26 of the 33 nations for which Pew has comparable data back to 2002. Not surprisingly, U.S. foreign policy, notably the war in Iraq, has been instrumental in lowering the U.S.’s image in the eyes of the world, but it is not the only cause.
Global support for the U.S.-led war on terrorism continues to decline, at the same time as the United States is the nation blamed most often for damaging the environment.
The survey also pointed to a deepening dislike of American values, ideas and customs — and a growing backlash against American ideas of democracy. In addition, the survey found negative attitudes toward American ways of doing business.
Many admirers
However, in 42 of 46 foreign nations surveyed, majorities say they admire U.S. technological and scientific capabilities. The poll also indicates widespread admiration for U.S. cultural exports — although in many nations, majorities believe that it is bad and worrisome that American ideas and customs are spreading to their nations.
By region, U.S.’s popularity continues to decline in the Middle East, Latin America, China, Turkey and Brazil. America’s popularity in “New Europe” has begun to slip as well, while among traditional allies of the United States in Western Europe, public opinion towards the United States has never been lower.
Plunging image
America’s image in France and Germany has plunged during the past year. Only 30% of Germans and 39% of those living in France have a positive view of the United States — a worrisome trend, considering that Germany and France are among the largest and most profitable markets in the world for U.S. multinationals.
In Britain, the U.S.’s image has sunk to a new low: Only a slim majority (51%) maintains a favorable view of the United States, which is down sharply from 75% in 2002.
Anti-Americanism has rarely been as prevalent and widespread as in the past five years. These circumstances have led many analysts to worry about a possible boycott or backlash against U.S. goods and services.
Sour image, soaring profits
I am one of those analysts who thought high-profile U.S. brands were at particular risk — but nothing of the sort has materialized. Indeed, U.S. global earnings, as measured by foreign affiliate income, have soared during the past half-decade.
Remarkably, the sinking U.S. image overseas coincided with a more than doubling of U.S. global earnings. In 2006, foreign affiliate earnings totaled a record $291.5 billion — a 170% jump from 2001’s cyclical low. U.S. multinationals reported a synchronized, global profit boom, with record earnings in virtually every region of the world.
Better economical gains
In Germany, where the image of the United States has plummeted, U.S. affiliate earnings nearly tripled between 2002 and 2006. During the same period, affiliate earnings more than doubled in France and the United Kingdom.
And the good times roll on: In the first quarter of 2007, U.S. global earnings soared 12% from the same period a year ago, rising to a quarterly record of $75.7 billion. U.S. global earnings are currently running at another record-breaking pace — a trend that flies in the face of the anti-U.S. findings of the Pew survey and many others like it.
What explains the apparent paradox of America’s battered global image on one hand — and booming global earnings on the other?
The conundrum explained
For starters, strong global demand and a weak U.S. dollar have boosted U.S. global earnings during the past few years. Beyond these cyclical forces, however, other factors are at work.
U.S. global brands — both consumer and business-to-business — remain among the strongest in the world and continue to inspire deep loyalty among foreign customers. In a recent ranking conducted by BrandZ, eight of the top ten and 15 of the top 20 most valuable brands in the world were American.
The boom in global earnings also reflects corporate America’s peerless global reach and the extraordinary success of U.S. firms in building global networks and leveraging global resources, while tailoring goods and services to local tastes.
Reflection on U.S.'s strengths
Many U.S. multinationals deliver goods and services through foreign affiliates that are embedded in local communities. In many cases, these affiliates are just as local as the locals, providing cover during times of rising anti-Americanism.
Strong global capabilities in marketing, logistics, finance and after-sales services have helped offset America’s rogue image. Superior products, especially the U.S. information technology capabilities, have boosted U.S. companies’ global earnings as well.
Finally, the disconnect between the poor image/strong earnings could lie with the survey itself. Foreign attitudes toward Americans are often more positive than attitudes toward the United States as a nation.
http://www.theglobalist.com/StoryId.aspx?StoryId=6369quote:How the U.S. Middle Class Became 10% Poorer
By Jacob Kirkegaard | Wednesday, August 01, 2007
Much has been made of stagnant U.S. middle class wages in the face of record corporate profits and a booming stock market. As Jacob Kirkegaard explains, the OECD has redefined the middle class — to the detriment of the United States but to the benefit of other major economies.
The OECD in Paris has monumental news for middle class America. The OECD, of course, is the most trusted source for internationally comparative data on economic issues in the developed world.
Its statistical department, in cooperation with member states’ national statistical agencies, is engaged in an exercise to turn often diverse national statistical surveys of very different “middle classes” into cross-country datasets that enable true comparisons across countries.
Statistics at play
So what’s the bombshell buried in the statistical pile? As it turns out, the OECD statisticians have just — in one fell swoop — lowered the estimated income for the average American worker by more than 10%, and at the same time raised incomes for the middle classes of other major countries by up to more than 30%.
Sadly, it will likely be lost on CNN’s Lou Dobbs (and his viewers) that the culprit here is not globalization or wicked foreign workers competing on an uneven playing field — but a matter of mere statistical validity.
Evidently, all statistical work is caught between statistical accuracy (which researchers like) — and the need to keep costs and the burden of respondents down (which is preferred by taxpayers and those who are measured).
Changing data
Subsequently, what the OECD has used until recently as a proxy for the “middle class” was the set of data that was most widely available across member states. It is the concept of the "average production worker" (APW).
This group includes adult full-time workers who are directly engaged in a production activity in the manufacturing sector, including manual (non-supervisory) workers and minor shop-floor supervisory workers. Excluded were non-manual (supervisory) workers, part-timers and all workers outside the manufacturing sector.
Better representation
Those statistics represented the industrial economy quite well but also ensured that a relatively small (and declining) subset of workers outside booming sectors like technology or finance came to represent the “middle class” statistically.
Another distorting factor was that, in the case of the United States, the manufacturing sector is typically far more unionized than the rest of the economy. And that means their wages are higher than in non-unionized fields of the economy.
However, as a result of better statistical data-gathering across other sectors of the economy in more countries, the OECD recently updated its definition of “the middle class.” It now focuses on "the average worker" — rather than “the average production worker.”
A wide range
This new proxy for the middle class captures a far larger group than the old one — and includes essentially the entire private-sector economy. It ranges from mining and quarrying, utilities, construction, wholesale/retail/repair, hotel/restaurants and transportation to financial services and real estate — and includes both manual and non-manual workers.
Included in middle class income are all wages, cash supplements, bonuses, overtime pay, holiday pay, Christmas bonuses etc.
Varying effects
Interestingly enough, this one change in statistical methodology has very different effects on the middle classes in different OECD countries.
While the United States saw a decrease in average income of 10% — the biggest decline of all 30 member states — the income of the British middle class rose by 32%. Similarly, France's, Germany's and Japan's average income increased by 28%, 20% and 17%, respectively.
A small consolation for U.S. middle class workers would be that the incomes of its nearby Canadian brethren also declined by 5%.
Effects of unions
In the United States (and Canada), the manufacturing sector is highly unionized, especially in comparison to other sectors of the economy. Detroit’s auto workers, in particular, have traditionally enjoyed a status of “princes of labor,” earning far higher wages than most other U.S. private-sector workers, especially in many services sectors like construction, hotels and restaurants.
Now that these services sectors are included in calculating “the middle class” pay level, the average income of the U.S. middle class has evidently gone down quite substantially.
Accurate results
Mind you, lest CNN’s Lou Dobbs and other prognosticators of doom get too excited, it is important to remember that this decline in income is a statistical correction. U.S. income levels in the past had appeared higher than they were in reality.
Moreover, it is quite revealing that even the inclusion of the very high earning levels in the financial services sectors in the middle class — especially as supervisory workers (management) are now also counted — did not in the aggregate in the case of the United States act as a sufficient counterweight to the inclusion of more low-income workers.
Contrast that with the situation in the UK, where evidently the inclusion of the financial sector of the city of London boosted “average middle class incomes” by about a third. Either London's bankers earn far more than Wall Street's, or there are far more low wage middle class people in the United States than in the UK.
Richest middle class
The result of all this is that today, the richest middle class in the OECD is found in Britain. In 2006, an average single British middle class worker earning the average wage, net of taxes and in PPP terms, had an income nearly 50% higher than his U.S. counterpart — $35,000 compared to $25,000.
As a matter of fact, U.S. middle class workers found themselves outside the top ten in the OECD.
Marriage not a solution
And it doesn’t even help to marry. A British middle class family with two children and two incomes of 100% and 67% of average wages still earns over 40% more (in PPP terms, net of taxes) than their U.S. counterparts ($65,000 compared to $45,500). In fact, U.S. families in this category rank only 15th in the OECD.
It may well be outside the realm of sanity to an American visiting London that a small lunch salad at Wimbledon is £8 — or more than $16. But the truth is that it is probably not outside the purchasing power of the middle classes — or at least not the British one.
Abortion Raises Crime Rates, Economist Says
By Fred Lucas
CNSNews.com Staff Writer
August 09, 2007
(1st Add: Includes additional comments from John Lott.)
(CNSNews.com) - Legalized abortion has led to increased crime, according to a recently published study of people born before and after the Supreme Court's 1973 Roe v. Wade decision.
The study seems to completely contradict the findings published in the New York Times bestseller, "Freakonomics," and has sparked a heated debate among academics, news reporters and commentators.
"Freakonomics," by economist Steven Levitt and journalist Stephen Dubner, claimed that legalized abortion reduced crime.
The new study concluded that legalized abortion increased murder rates about 7 percent.
These findings were published in April 2007 in the academic journal Economic Inquiry and were included in the new book, "Freedomnomics," by John R. Lott, published in June. Lott's book is, in many ways, a conservative response to the liberal claims in Levitt's book.
Lott's study argues that after the high court ruled that states must allow abortion, more permissive sexual behavior and less contraception produced three things: an increase in out-of-wedlock births, a reduction in the number of children placed for adoptions, and fewer married parents.
"Those are contradictory directions," Lott, an economist and senior research scientist at the University of Maryland, told Cybercast News Service. "What ties them together is liberalized abortion rules. It affected decisions on premarital sex and careful contraception. It's a matter of economics. When something seems less costly, there's more of it."
Lott noted there are many good single mothers doing an excellent job rearing their children. But those children almost never get as much attention as children in a two-parent family, he said. Further, children in single-parent families statistically have more social development problems and thus statistically are more likely to be criminals.
Levitt and Dubner, conversely, concluded that "liberalized abortion led to less unwantedness, and unwantedness leads to high crime; legalized abortion, therefore, led to less crime."
Outside of the Lott and Levitt debate, there are at least two other studies - one from the United States and one from Great Britain - that suggest no correlation between legalized abortion and lower crime rates.
Ted Joyce, an economics professor at City University of New York, conducted a study, concluding there is "little evidence to support the claim that legalized abortion caused the reduction in crime."
The British study, done by two U.K. professors and Leo Kahane of California State University-East Bay, determined it was "unable to find a link between the legalization of abortion and reductions in crime in England and Wales."
Dueling data on abortion
Because there is often more demand for something that is less costly, said Lott, fewer men felt obligated to marry women as in the past because of liberalized contraception and abortion laws. But when it came to an actual abortion, far fewer women than anticipated could go through with it and decided to keep their babies, Lott said.
Out-of-wedlock births were 5 percent of all births between 1965 to 1969, according to Lott's study. That rose to 16 percent of all births 20 years later. Among blacks, the number jumped from 35 percent to 62 percent.
Although crime rates fell in the 1990s, the drop was in arrests of older people born before the Roe v. Wade ruling, according to Lott. And those born four years after Roe v. Wade were more likely to commit murder. As a result, murder rates increased between 0.5 percent and 7 percent as a result of abortion, the study concluded.
However, a 2001 analysis by Levitt of the University of Chicago and John Donohue, a law professor at Yale University, showed otherwise.
Their study looked at Alaska, California, Hawaii, New York and Washington: the five states that had legalized abortion before 1973.
"Between 1988 and 1994, violent crime in the early legalizing states fell 13 percent compared to the other states," they reported. And "between 1994 and 1997, their murder rates fell 23 percent more than those other states."
"Freakonomics" further reports: "The states with the highest abortion rates in the 1970s experienced the greatest crime drops in the 1990s, while states with low abortion rates experienced smaller crime drops. ... Since 1985, states with high abortion rates have experienced a roughly 30 percent drop in crime relative to low-abortion states."
The information from the Donohue and Levitt study, however, over-simplifies the data, according to Lott.
As for the state-by-state comparisons, the Levitt-Donohue study data were collected on the false premise that abortion was entirely banned in 45 states before Roe, Lott said.
"No state banned abortions. They allowed exceptions for the life or the health of the mother," he said. "Kansas, of all places, had a lot of abortions. In California, prior to 1969, hospitals had a three-doctor panel that would decide whether the mother's life or health was in danger (to warrant an abortion). In Kansas, the woman's doctor could decide."
"Some states had a fair number of abortions. Some were more restrictive," he said. "You can't assume there was zero before Roe."
Questions surrounding researchers
Further, in 2005, The Economist magazine reported that two economists with the Federal Reserve Bank of Boston determined that the Levitt-Donohue study was filled with statistical errors. The magazine opined, "To be politically incorrect is one thing; to be simply incorrect, quite another."
Levitt was traveling this week and deferred comment to Donohue.
In a written statement, Donohue did not comment on either study. He instead raised questions concerning Lott's research methods and said, "I am a social scientist, however, so Lott's behavior has in my mind, put him outside the bounds of scientific discourse."
Donohue was referring to Lott's 1998 book, "More Guns Less Crime," which was roundly criticized in some academic circles and on blogs for allegedly being founded on faulty research. Lott also admitted to going on to one of the blogs under a different name to defend his work, a practice that many academics engage in.
Lott disputed the criticism.
Despite those controversies, Lott's commentaries continue to be reviewed and published in such places as The New York Times and The Wall Street Journal, as well as other establishment media.
The two sides of the abortion debate take predictable stances on the conflicting data.
"Lott offers so many unfounded, fallacious, racist, and confused assumptions that his overall opinions are useless," said Marjorie Signer, spokeswoman for the Religious Coalition for Reproductive Rights, in a statement sent to Cybercast News Service.
"To speculate that abortion is responsible for various and sundry social trends is irresponsible and misses critical points," she said.
"Abortion has always been an option that women at all socioeconomic levels have considered, and many abortions are performed for medical reasons. Trying to correlate abortion with social trends smacks of pseudo-science and shows little understanding of women's lives and decisions," Signer added.
Yet David O'Steen, executive director of the National Right to Life Committee, said making abortions more accessible would almost necessarily lead to more crime.
"If you increase a violent activity, it will lead to a coarsening of society," O'Steen told Cybercast News Service. "It would be extraordinary if it did not lead to a more violent society."
Good intentions and tender feelings may do credit to those who possess them, but they often lead to ineffective — or positively destructive — policies ... Kevin D. Williamson
http://www.knack.be/nieuw(...)n24-article7450.htmlquote:Geen olie, wel hersens
27/08/2007 13:00
Volgens een studie van de Wereldbank zijn België en Luxemburg samen het tiende rijkste land per capita in de wereld.
Wie bij 'rijke landen' alleen denkt aan olie, ertsen of fabrieken mist een groot deel van het verhaal. Volgens economen van het milieudepartement van de Wereldbank vertegenwoordigen ongrijpbare, immateriële elementen immers meer dan driekwart van de globale rijkdom.
In een studie van 2005 maken Kirk Hamilton en zijn collega's een onderscheid tussen drie vormen van kapitaal: 'natuurlijk', 'geproduceerd' en 'immaterieel' kapitaal. Natuurlijk kapitaal, goed voor 4 procent van de totale wereldrijkdom, is de som van landbouwgrond, bossen en niet hernieuwbare bronnen zoals olie, gas, kolen en mineralen. Geproduceerd kapitaal in de vorm van machines, infrastructuur, en verstedelijkt land vertegenwoordigt 18 procent. De overige 78 procent bestaat uit 'kapitaal dat wel een economische waarde heeft, maar dat je niet op je voet kunt laten vallen', zegt Hamilton.
Wat landen echt rijk maakt, is volgens de studie de brainpower en de instituties die die bruikbaar maken. Kennis en vaardigheden, het onderwijssysteem waardoor die ontwikkeld worden en de sociale instituties waarin ze kunnen worden gebruikt, zijn dus cruciaal. De term 'instituties' moeten we breed begrijpen. 'Iets alomvattends zoals de rechtsstaat valt daaronder, maar ook een wijkcomité', zegt Hamilton.
Alles samengeteld blijkt Zwitserland het meest welvarende land met een rijkdom van 648.241 dollar per hoofd. Denemarken en Zweden vervolledigen de top drie, met respectievelijk ongeveer 73.000 en 135.000 dollar per capita minder. België en Luxemburg, die in de studie als één entiteit worden behandeld, staan op de tiende plaats met 451.714 dollar per hoofd, dat is goed 30.000 meer dan Nederland. Het kapitaal van België en Luxemburg is voor 1 procent natuurlijk, voor 13 procent geproduceerd en voor 86 procent immaterieel.
Onderaan de lijst van 120 landen bungelt Ethiopië met slechts 1965 dollar per capita, net daarboven staan Nigeria, Burundi en de Democratische Republiek Congo. Opmerkelijk is dat de dertig welvarende OESO-landen (Organisatie voor Economische Samenwerking en Ontwikkeling) gemiddeld maar 2 procent van hun rijkdom halen uit natuurlijke bronnen, terwijl dat bij de armste landen maar liefst 26 procent is.
BRON: WHERE IS THE WEALTH OF NATIONS? Measuring Capital for the 21st Century (2005), te downloaden van www.worldbank.org
Jan Jagers
Ethiopie is trouwens nauwelijks een kolonie geweest

http://www.nd.nl/Document.aspx?document=nd_artikel&id=98917quote:Onderzoek: celstraf werkt averechts
DEN HAAG - Gevangenisstraf helpt niet. Criminelen die een celstraf ondergaan, worden na hun vrijlating vaker veroordeeld dan criminelen die niet in de gevangenis hebben gezeten. Dat blijkt uit onderzoek van de criminologen Paul Nieuwbeerta en Arjan Blokland.
De twee onderzoekers van het Nederlands Studiecentrum voor Criminaliteit en Rechtshandhaving (NSCR) vergeleken voor hun studie bijna drieduizend criminelen van 26 tot 28 jaar. Daaruit blijkt dat criminelen die een celstraf opgelegd krijgen, in de drie jaar na hun vrijlating meer veroordelingen op hun naam hebben dan daders die niet in de gevangenis terechtkomen. De onderzoekers noemen de resultaten opmerkelijk. ,,Het toont in ieder geval aan dat een gevangenisstraf ex-gedetineerden niet van nieuwe delicten weerhoudt. Celstraf werkt in zekere zin averechts.''
Leerschool?
Naar de oorzaak van dat averechtse effect is het echter gissen, aldus de onderzoekers. Nieuwbeerta betwijfelt of de uitkomst een bevestiging is van het idee dat de gevangenis de beste leerschool is voor criminelen. Zo zaten de onderzochte gedetineerden gemiddeld maar vier maanden vast. ,,Ik kan me moeilijk voorstellen dat nieuwe gevangenen in zo'n korte periode de kneepjes van het vak van medegevangenen leren en daardoor na hun straf extra actief worden. Of dat ze zo gehard uit de gevangenis komen dat ze zich vaker op het criminele pad begeven.''
Nieuwbeerta zoekt de verklaring eerder in de periode ná de vrijlating.
,,Ex-gedetineerden hebben een grote kans hun baan, hun partner en hun huis kwijt te raken. Hun omgeving reageert anders op hen. Ze dragen een bepaald stigma met zich. Dat maakt dat ze mogelijk verder maatschappelijk ontwricht raken.''
Een andere mogelijke oorzaak is dat criminelen die een celstraf hebben uitgezeten beter bij de politie bekend zijn en na hun vrijlating scherper in de gaten worden gehouden en dus vaker worden opgepakt. Maar die kans acht Nieuwbeerta klein. ,,De politie kan niet aan iedereen die vrijkomt na een celstraf extra aandacht besteden. Het is niet zo dat er dan een signaal afgaat op het politiebureau.''
Methode
De twee criminologen gingen in hun onderzoek als volgt te werk. Ze koppelden iemand die bijvoorbeeld op zijn 27e voor het eerst tot een celstraf werd veroordeeld aan mensen die op dezelfde leeftijd een vrijwel identiek strafblad hadden. Zij zijn gedurende hun 27e levensjaar echter (nog) niet de gevangenis in gegaan, of kregen slechts een boete of een taakstraf opgelegd. Vervolgens onderzochten ze van alle proefpersonen het aantal keren ze in de drie jaar erna werden veroordeeld.
De onderzoekers kozen bewust voor de leeftijdscategorie 26-28 jaar, omdat de criminele carrière van de proefpersonen zich dan al dusdanig heeft ontwikkeld dat ze goed te vergelijken zijn. Bovendien piekt crimineel gedrag aan het einde van de jongvolwassenheid en neemt die tijdens de volwassenheid weer geleidelijk af. Met andere woorden: vanaf het 26e levensjaar onderscheidt de beroepscrimineel zich van de boefjes.
Het onderzoek beperkte zich tot mensen van maximaal 28 jaar omdat de kans dat iemand daarna nog voor het eerst tot een gevangenisstraf wordt veroordeeld steeds kleiner wordt.
Het onderzoek wordt binnenkort gepubliceerd in het tijdschrift Mens en Maatschappij .
"I think I'm in a tragedy"
[youtube]http://www.youtube.com/watch?v=FZFG5PKw504[/youtube]
"In America today profit is privatized but risk is increasingly socialized"
[youtube]http://www.youtube.com/watch?v=FZFG5PKw504[/youtube]
"In America today profit is privatized but risk is increasingly socialized"
artikel over hoe en waarom de Verenigde Staten van een bad boy op gebied van internationale handel veranderde naar een land dat zich wel hield aan de internationale handelsregels en hoe dat tot stand kwam:
A nation of outlaws
A century ago, that wasn't China -- it was us
A nation of outlaws
A century ago, that wasn't China -- it was us
http://www.knack.be/nieuw(...)n24-article8386.htmlquote:Het einde van de middenklasse
25/09/2007 15:00
De globalisering maakt de wereld rijker. Maar de kloof tussen arm en rijk wordt groter, en de loontrekkende middenklasse verarmt zienderogen. Oók bij ons. Knack verzamelde nieuwe cijfers, die de mythe van de verzuurde, vadsige Vlaming onderuithalen.
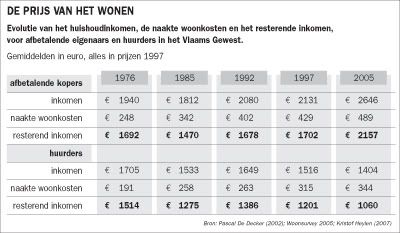
Een van de centrale ijkpunten die het verdwijnen van de middenklasse kunnen illustreren, zijn de kosten van het wonen. Houden we meer over dan vroeger nadat we de huur of hypotheekrente betaald hebben?
Veel mensen hebben de indruk dat het vroeger makkelijker was om met het inkomen van één enkele broodwinner een woning te kopen of te huren. Dat zou te wijten zijn aan het feit dat de woonkosten sneller zijn gestegen dan de inkomens. Kristof Heylen van het Hoger Instituut van de Arbeid (HIVA-KU-Leuven) onderzocht het voor ons.
De tabel 'De prijs van het wonen' toont een groot verschil tussen huurders en afbetalende eigenaars. Wat de huurder overhoudt na de betaling van zijn huur (het resterende inkomen), ligt nu bijna 500 euro lager dan in 1976. Bij de afbetalende eigenaars is het resterende inkomen juist sterk gegroeid.
Dat 'tweestromenland' heeft niet enkel te maken met de huurprijzen, maar evenzeer met het feit dat de groep huurders nu meer bestaat uit mensen met een lager inkomen.
Kristof Heylen van het HIVA splitste de gegevens verder uit naar hoge en lage inkomens. Daaruit blijkt dat er ook bij afbetalende eigenaars grote verschillen zitten achter de gemiddelden: het resterende inkomen bij de 20 procent eigenaars met de laagste inkomens ligt nu lager dan in 1985. De 30 procent hoogste inkomens zagen hun resterend inkomen fors stijgen. Het is hier - op dit snijpunt van de evolutie van arbeidsinkomens met de evolutie van onroerende vermogens(inkomens) - dat de dualisering in de Vlaamse samenleving het best zichtbaar wordt.
John Vandaele
quote:Op dinsdag 18 oktober 2005 16:11 schreef zakjapannertje het volgende:
hoe corrupt zijn landen tov andere landen? Transparency International zocht het uit:
[..]
http://ww1.transparency.org/cpi/2005/2005.10.18.cpi.en.html
(helemaal beneden scrollen voor de ranglijst)
http://www.wereldomroep.nl/actua/europa/070927anti-corruptiequote:Europa scoort op anti-corruptielijst
Door Perro de Jong
27-09-2007
Perro de Jong over CPI-index
Op de nieuwe ranglijst van Transparency International van de minst corrupte landen doet Europa het ongekend goed. Zelfs zorgenkindje Roemenië ging volgens de anti-corruptie waakhond het afgelopen jaar met sprongen vooruit. Ook buiten de Europese Unie zijn er positieve ontwikkelingen, maar die zijn niet noodzakelijk gebaseerd op aanwijsbare trends. Want wat doet bijvoorbeeld Suriname opeens bij de snelle stijgers?
In vergelijking met 2006 gaat Suriname omhoog van de 90e naar de 72e plaats. De voormalige Nederlandse kolonie deelt nu een plaats met grote jongens Brazilië en China. Toch is er in Suriname geen sprake geweest van grote politieke of economische verschuivingen. Toen een aantal Amerikaanse landen vorig jaar een anti-corruptie declaratie tekende, was Suriname niet eens van de partij.
Ook bij het enige Transparency International kantoor in de regio, op Trinidad, hebben ze geen verklaring. "Ik was zelf net zo verbaasd dat Suriname opeens zo omhoog is geschoten", zegt directeur Victor Hart. "Het sluit ook helemaal niet aan bij de rest van de verschuivingen in de regio."
Achilleshiel
Dit soort onverklaarbare uitschieters laat de achilleshiel zien van de CPI, de Corruptie Perceptie Index die TI sinds 1995 elk jaar publiceert. De scores zijn niet gebaseerd op harde feiten maar op indrukken van ondernemers en experts uit de 180 onderzochte landen. Die zijn lastig te verifiëren. Indrukken vormen ook de basis van de goede resultaten in de EU. Denemarken mag zich nu het minst corrupte land ter wereld noemen, samen met Finland en Nieuw-Zeeland. Nederland haalde Zwitserland in en steeg van de 9e naar de 7e plaats. Ook de nieuwe lidstaten boekten bijna allemaal forse vooruitgang.
"Indrukken kunnen natuurlijk door allerlei zaken beïnvloed worden, maar door de bank genomen geven ze toch een realistisch beeld" zegt Transparency's Europa-directeur, Miklos Marschall. Volgens hem is het misschien wel voor het eerst in de geschiedenis van de CPI dat er sprake is van zo'n duidelijke trend van overal kleine verbeteringen. En die trend schrijft hij toe aan het EU-lidmaatschap:"Bij het proces van toetreding werd druk uitgeoefend van buitenaf", zegt Marschall. " Je ziet het resultaat daarvan niet alleen in landen als Slovenië en Estland maar ook in relatief corrupte landen als Bulgarije en Roemenië".
Smeergeld
Ook de Wereldbank, die bekend staat om de stringente eisen waar cliënten aan moeten voldoen, benadrukt het belang van de CPI. "Indrukken doen er wel degelijk toe", zegt Daniel Kaufmann, de directeur van het kenniscentrum van de Wereldbank in Washington.
"Wat de ondernemers en de burgers van een land vinden, beïnvloedt hoe ze stemmen en hoe ze investeren. Bovendien zijn de vragen tegenwoordig heel rigoureus en wetenschappelijk. Er wordt bijvoorbeeld gevraagd hoeveel smeergeld een bedrijf precies heeft moeten betalen. Dat is heel iets anders dan subjectieve vragen als 'is er volgens u veel of weinig corruptie in uw land?"
De lijst van Transparency International en de eigen bevindingen van de Wereldbank komen volgens Kaufmann voor meer dan negentig procent overeen. En dat geldt zeker voor Europa.
Overigens moet de impact van de Europese Unie ook weer niet overschat worden. Met een rapportcijfer van 3,7 staat kersvers EU-lid Roemenië nu op ongeveer dezelfde hoogte als Ghana en Colombia. "Er is nog veel werk te doen", beaamt ook Europa-directeur Marschall. Of de veranderingen werkelijk meer zijn dan kortstondige euforie over het EU-lidmaatschap zal de lijst van volgend jaar moeten uitwijzen.

|
|