W&T Wetenschap & Technologie
Een plek om te discussiëren over wetenschappelijke onderwerpen, wetenschappelijke problemen, technologische projecten en grootse uitvindingen.


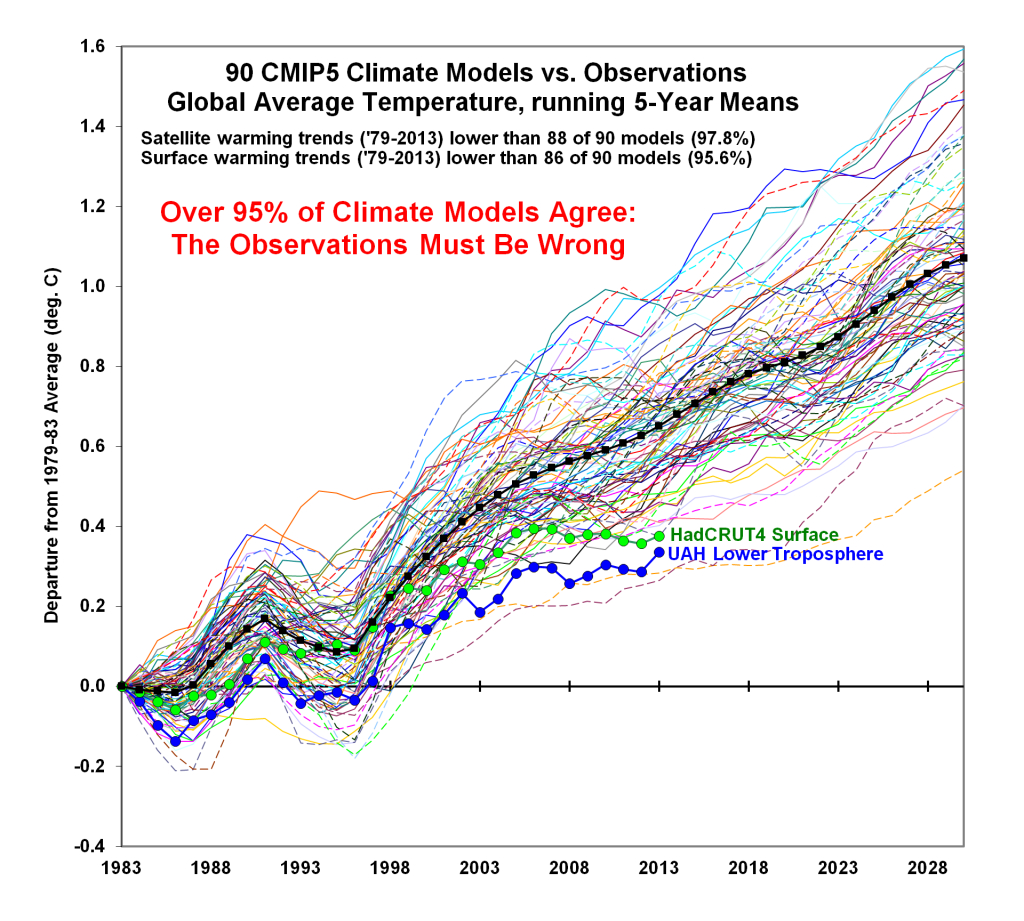
Er zullen vast wel wat modellen zijn waar de projectie niet goed van is, maar welke observaties wijken in het bijzonder af dan? Ja, ze zaten wat te hoog met de 'pause', wat naar het zich doet aan zien idd deels intern en deels extern te verklaren is, maar goed, het beeld ziet er inmiddels zo uit:quote:Op zondag 23 juli 2017 23:07 schreef MrRatio het volgende:
[..]
De diverse modellen van klimaat suggereren inderdaad momneteel een giga klimaatverandering. Dit wordt niet bevestigd door observaties.

De laatste miljoen jaar is zo'n snelle stijging niet voorgekomen (als ik de CO2 grafieken mag geloven). Eerder misschien wel, ten tijde van de asteroid impact 65 miljoen jaar geleden zou CO2 van 350-500 ppm naar minstens 2300 ppm gestegen zijn in een periode van 10000 jaar. Of nauwkeuriger, 10000 jaar na de impact bevatte de atmosfeer minstens 2300 ppm CO2 (als we deze studie mogen geloven).quote:
[..]
De bron?
Zie linksonder in de grafiek.
[ afbeelding ]
http://www.geocraft.com/WVFossils/Carboniferous_climate.html
En hoe weet crystam_meth zo zeker dat de recente verandering van CO2 nog nooit eerder is voorgekomen? Van Al Gore?
Abrupte klimaatveranderingen zijn er zeker geweest: https://en.wikipedia.org/wiki/Abrupt_climate_change
Ik zeg dus niet dat het niet eerder is voorgevallen, maar niet in het "recente" verleden.
[ Bericht 5% gewijzigd door crystal_meth op 24-07-2017 17:52:26 ]
are we infinite or am I alone
Ik had dit plaatje voor ogen:quote:Op zondag 23 juli 2017 23:32 schreef ExtraWaskracht het volgende:
[..]
Er zullen vast wel wat modellen zijn waar de projectie niet goed van is, maar welke observaties wijken in het bijzonder af dan? Ja, ze zaten wat te hoog met de 'pause', wat naar het zich doet aan zien idd deels intern en deels extern te verklaren is, maar goed, het beeld ziet er inmiddels zo uit:
[ afbeelding ]
En dit plaatje, opwarming van de troposfeer is een interessante parameter om de broeikashypothese te toetsen. De temperatuurreeksen met stijging zijn vooral afkomstig van land based thermometers. De troposfeer wordt gemeten met ballonnen en met satellieten.
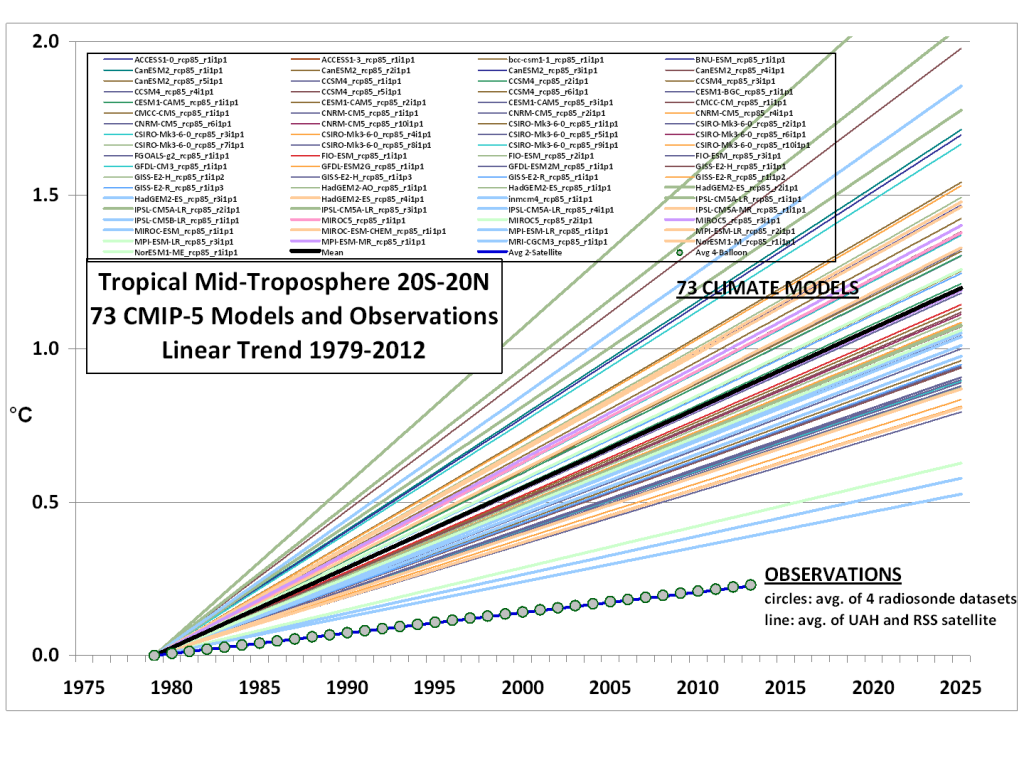
Bron: http://www.drroyspencer.c(...)spheric-temperature/
[ Bericht 23% gewijzigd door MrRatio op 24-07-2017 18:24:37 ]
Environmentalism and its most extreme version, global warming alarmism, asks for an almost unprecedented expansion of government intrusion and intervention into our lives and of government control over us.
Václav Klaus
Václav Klaus
Ah ja, dat plaatje is inderdaad wat verouderd. Daarbij zou ik eraan toevoegen dat 100% van de modellen fout zijn. Spreken over slechts 95% lijkt me hopeloos optimistisch.quote:
[..]
Ik had dit plaatje voor ogen:
[ afbeelding ]
Overigens vertrouw ik grafieken maar matig waarin tekst staat om dingen naar je toe te schreeuwen als een of andere marketing-actie. Heb daarbij dan de indruk dat het hoofddoel is om propaganda te maken.
Deze kende ik nog niet. Anyway, curieus dat hij zegt dat het het gemiddelde is van "UAH en RSS satellite", waar RSS TMT tussen 25S en 25N op 0.149K/decade zit, wat een ander beeld geeft dan wat hij hier toont (en als je kijkt naar de trend van 1979-2012 ipv heden zit je alsnog op 0.123 K/decade). Geen idee wat het zal zijn tussen 20S en 20N, maar something smells fishy en als het echt het gemiddelde is van de sets, waarbij de zijne op 0.0 oid zit en RSS op ~0.123 waarmee dan dit gemiddelde eruit komt rollen, weet ik niet goed wat deze grafiek in alle eerlijkheid zou moeten tonen.quote:En dit plaatje, opwarming van de troposfeer is een interessante parameter om de broeikashypothese te toetsen. De temperatuurreeksen met stijging zijn vooral afkomstig van land based thermometers. De troposfeer wordt gemeten met ballonnen en met satellieten.
[ afbeelding ]
Bron: http://www.drroyspencer.c(...)spheric-temperature/
(Hier kun je dat reproduceren. Channel = TMT v4.0, History = Full, Region = Tropics (-25,25))
[ Bericht 0% gewijzigd door ExtraWaskracht op 24-07-2017 21:00:30 ]
Wat mij direct doet twijfelen aan zowel de bron als de betrouwbaarheid van dat plaatje.quote:
[..]
Overigens vertrouw ik grafieken maar matig waarin tekst staat om dingen naar je toe te schreeuwen als een of andere marketing-actie. Heb daarbij dan de indruk dat het hoofddoel is om propaganda te maken.
Beetje zoals artikelen die het woord "klimaatalarmisme" gebruiken in de titel. Dat zijn de momenten dat ik ophoud met lezen. Het is dan al direct duidelijk dat het voorbij pogingen om betrouwbare wetenschap te bedrijven gaat. (Vergelijkbaar met het gebruik van het woord 'darwinisme' trouwens. Doorzichtige pogingen om wetenschap als ideologisch gedreven nonsens weg te zetten.)
[ Bericht 4% gewijzigd door Molurus op 24-07-2017 21:11:21 ]
Niet meer aanwezig in dit forum.
In 1976 zong Gerard Cox nog na de warmste zomer van de eeuw: "Het is weer voorbij die mooie zomer"quote:
[..]
Wat mij direct doet twijfelen aan zowel de bron als de betrouwbaarheid van dat plaatje.
Beetje zoals artikelen die het woord "klimaatalarmisme" gebruiken in de titel. Dat zijn de momenten dat ik ophoud met lezen. Het is dan al direct duidelijk dat het voorbij pogingen om betrouwbare wetenschap te bedrijven gaat. (Vergelijkbaar met het gebruik van het woord 'darwinisme' trouwens. Doorzichtige pogingen om wetenschap als ideologisch gedreven nonsens weg te zetten.)
De enige mensen die bij een mooie zomer klagen zijn de weermannen en -vrouwen.
SPOILEROm spoilers te kunnen lezen moet je zijn ingelogd. Je moet je daarvoor eerst gratis Registreren. Ook kun je spoilers niet lezen als je een ban hebt.Weten wat men weet en weten wat men niet weet: dat is kennis - Confucius
Enig idee hoe vaak ik de term "klimaatscepticus" tegenkom?quote:
[..]
Wat mij direct doet twijfelen aan zowel de bron als de betrouwbaarheid van dat plaatje.
Beetje zoals artikelen die het woord "klimaatalarmisme" gebruiken in de titel. Dat zijn de momenten dat ik ophoud met lezen. Het is dan al direct duidelijk dat het voorbij pogingen om betrouwbare wetenschap te bedrijven gaat. (Vergelijkbaar met het gebruik van het woord 'darwinisme' trouwens. Doorzichtige pogingen om wetenschap als ideologisch gedreven nonsens weg te zetten.)
Wat ook nog eens een hele domme kreet is. Wie kan er nu sceptisch zijn dat er een klimaat is? Dat er ijstijden geweest zijn?
Weinig wetenschappelijks in de quote overigens, misschien beter op de plek in de F&L.
Environmentalism and its most extreme version, global warming alarmism, asks for an almost unprecedented expansion of government intrusion and intervention into our lives and of government control over us.
Václav Klaus
Václav Klaus
Even een rondje langs de velden:
Een nieuwe benadering van meetdata laat zien dat de opwarming wel meevalt:
https://www.nature.com/articles/srep31789
In de categorie zorgelijk:
https://wattsupwiththat.c(...)ses-climate-realism/
Hier een overzichtsartikel over het urban heat island efect. Zou dit de verklaring zijn achter de verschillen tussen land based temperatuurmetingen en satelliet/weerballonnen? Lijkt me wel.
http://notrickszone.com/#sthash.3lM3RPE7.dpbs
Weer een ander voorbeeld waarin C14 en Be10 variaties correleren met klimaatschommelingen:
https://judithcurry.com/2(...)e-part-a/#more-23197
https://judithcurry.com/2(...)and-human-societies/
https://judithcurry.com/2(...)r-bray-cycle-part-b/
Niks CO2 dus, wel iets met kosmische straling/zonne-activiteit.
Environmentalism and its most extreme version, global warming alarmism, asks for an almost unprecedented expansion of government intrusion and intervention into our lives and of government control over us.
Václav Klaus
Václav Klaus
Hoezo?quote:
[..]
Weer een voorbeeld van een club die data masseert om alarm te slaan over het klimaat. Qua timing handig, net voor de G20 top in Hamburg.
http://notrickszone.com/2(...)sthash.vCYpIafd.dpbs
De DWD spreekt over honderden miljoenen mensen in kuststeden, wat duidelijk een uitspraak is over mondiale gevolgen, en het artikel verwijst naar het zeepeil in Cuxhaven aan de Duitse kust om dat tegen te spreken...quote:Just recently in the run-up to the G20 summit in Hamburg, the DWD issued a press release warning of dramatic peril from sea level rise coming stemming from global warming. It wrote that coastal cities will see “considerable risks for living space for hundreds of millions of people. built structures and insfratsucture worth trillions of dollars are imminently threatened by sea level rise. Today’s emissions will lead over the long term laxtensive coastal strips of land being being below the sea level.”
The DWD then went on to call for urgent “fact-based” action to be taken by world leaders.
The DWD in its press release mentioned that Germany’s coasts has seen sea level rise 10-20 cm over the last century, which is correct.
However the current rate of rise has in fact slowed down, according studies by the University of Siegen: 1.7 mm/year [5], Knake writes. Before that officials had assumed 2.5 mm/year. That means German coastal sea level rise is a full one third below what was previously thought.
Als de ijskappen op Groenland smelten zal het zeepeil in de omgeving dalen, wegens minder gravitatiekracht (momenteel trekt de massa het water in de omgeving aan, het veroorzaakt een "bult" in het zeeoppervlak).
http://www.sciencemag.org(...)ea-level-some-placesquote:When Greenland melts, places as far away as Norway and Scotland could actually see the sea level fall by as much as 50 meters.
Maar dat water moet ergens heen, die daling zal gecompenseerd worden door een grotere stijging elders (zuidelijke hemisfeer, westkust van de VS etc..).
are we infinite or am I alone
Nog maar eens even de link goed lezen, de Duitse KNMI schetst een rampenscenario met enorme overstromingen.
Een ander instituut, de EIKE, heeft hier een heel ander beeld bij.
De timing is wel opvallend, vlak voor de top in Hamburg nog even een sfeer proberen te scheppen om knopen door te hakken, en de miljarden toe te kennen voor het te laat is.
Een ander instituut, de EIKE, heeft hier een heel ander beeld bij.
De timing is wel opvallend, vlak voor de top in Hamburg nog even een sfeer proberen te scheppen om knopen door te hakken, en de miljarden toe te kennen voor het te laat is.
Environmentalism and its most extreme version, global warming alarmism, asks for an almost unprecedented expansion of government intrusion and intervention into our lives and of government control over us.
Václav Klaus
Václav Klaus
The use of T2 amplifies the regional contrasts of the warming rate, i.e., the trend underestimation in the US and overestimation at high latitudes by T2.quote:
Even een rondje langs de velden:
Een nieuwe benadering van meetdata laat zien dat de opwarming wel meevalt:
https://www.nature.com/articles/srep31789
But the allegations of “scientific consensus” are made only in one field – climate alarmism!quote:
Werkelijk?
Consensus statement on diagnostic end points for infant tuberculosis
This consensus statement summarizes the latest scientific knowledge on HPV infection, its epidemiology and association with cervical cancer, efficacy and safety of HPV vaccines
Veiligheid van vaccinaties, aspartaam, HAARP, fluoride in drinkwater, effecten van homeopatie en andere alternatieve geneeswijzen, allemaal zaken waar men verwijst naar "scientific consensus".
Het urban heat island effect is geen recente ontdekking. Dat blijkt reeds uit de aangehaalde studies (1988, 1989, 1992). Maar men stelt het voor alsof er geen rekening mee gehouden wordt.quote:Hier een overzichtsartikel over het urban heat island efect. Zou dit de verklaring zijn achter de verschillen tussen land based temperatuurmetingen en satelliet/weerballonnen? Lijkt me wel.
http://notrickszone.com/#sthash.3lM3RPE7.dpbs
Wat betreft de nieuwe studies die ze presenteren:
• Liao et al., 2017: is niet duidelijk of het meetstations betreft die voor globale data gebruikt worden.
• Parker and Ollier, 2017: men postuleert een natuurlijke cyclus van 60 jaar, en "hun model" zou wijzen op een nog langere cyclus waarvan het opgaande deel begon in 1910...
Op die manier kan je altijd een periodieke functie vinden die overeenkomt met de data.
Ze besteden drie bladzijden aan de temperatuurmetingen in één lokatie (een vuurtoren), voor de rest ook voornamelijk Australische data. Is me niet meteen duidelijk waar ze de conclusie over globale opwarming op baseren, want ze lijken data van NASA en GISS te gebruiken als bewijs dat de aanpassingen door het Australische metereologisch departement fout zijn... Verder suggereren ze om rauwe data te gebruiken....
As there is no way to perform a better measurement going back in the past, there is no legitimate way to correct recorded data of the past. Therefore, we should stick to the raw data.
the alleged increasing temperature is obtained by lowering temperatures of the past by “adjustments”
• Dienst et al., 2017: ze vatten het samen als: Moving Stations, ‘Adjustment’ Bias Adds +0.47°C To Temp Record Since 1800s, terwijl het artikel net adjustments bespreekt die de Urban heat island biases corrigeren.
• Levermore et al., 2017: Ja, Manchester zal warmer worden door het Urban heat effect, so?
Verder nog een aantal studies die niet relevant zijn (over Athene bvb), en studies die beweren dat aanpassingen van de data minder opwarming vertonen.
• With artifacts removed, the network’s 1991–2012 minimum temperature trend decreases from +1.16 °C decade−1 to +0.106 °C decade−1
• Using the regression model to filter the extraneous, nonclimatic effects reduces the estimated 1980–2002 global average temperature trend over land by about half.
• Current New Zealand century-long climatology based on 1981 methods produces a trend of 0.91 °C per century. Our analysis, which uses updated measurement techniques and corrects for shelter-contaminated data, produces a trend of 0.28 °C per century.
Dus papers die beweren dat raw data moet gebruiikt worden, en papers die beweren dat de data moet aangepast worden omdat de raw data teveel opwarming vertoont. En papers die misleidend voorgesteld worden. Lijkt me duidelijk dat niet alle papers even betrouwbaar zijn, maar ik ga m'n tijd niet besteden aan een grondige analyze.
Ik zou eerder zeggen dat die hypothese het effect van CO2 zou bevestigen.quote:Weer een ander voorbeeld waarin C14 en Be10 variaties correleren met klimaatschommelingen:
https://judithcurry.com/2(...)e-part-a/#more-23197
https://judithcurry.com/2(...)and-human-societies/
https://judithcurry.com/2(...)r-bray-cycle-part-b/
Niks CO2 dus, wel iets met kosmische straling/zonne-activiteit.
Skeptics verwijzen naar de "warming hiatus" als bewijs dat CO2 de temperatuur niet beïnvloedt. Maar de zonneactiviteit is sterk gedaald. Volgens de cosmic ray hypothese zou je zonder broeikaseffect een significante daling in temperatuur moeten zien. We zien daarentegen slechts een "pauze" in de opwarming, de logische conclusie is dat een andere factor (de stijgende CO2 concentratie) dat effect compenseert.
Solar cycle 21: begint in 1933; maximum 198.6;
overgang: 269 dagen zonder zonnevlekken
Solar cycle 18: begint in 1944; maximum 218.7;
overgang: 446 dagen zonder zonnevlekken
Solar cycle 19: begint in 1954; maximum 285.0;
overgang: 227 dagen zonder zonnevlekken, kortste periode sinds 1850
Solar cycle 20: begint in 1964; maximum 156.6;
overgang: 272 dagen zonder zonnevlekken
Solar cycle 21: begint in 1976; maximum 232.9;
overgang: 273 dagen zonder zonnevlekken
Solar cycle 22: begint in 1986; maximum 212.5;
overgang: 309 dagen zonder zonnevlekken
Solar cycle 23: begint in 1996; maximum 180.3;
overgang: 817 dagen zonder zonnevlekken
Solar cycle 24: begint in 2008; maximum 116.4 (laagste waarde in ruim een eeuw)
are we infinite or am I alone
Hierbij een andere kijk op de zaak:
https://sites.google.com/site/globalwarmingquestions/ar4uhi
Anthony Watts (van wattsupwiththat.com) constateerde dat een meetstation bij hem in de buurt onbetrouwbare data zou opleveren voor klimaatonderzoek. Dit werd genegeerd door de NOAA. Nieuwsgierig geworden ging Anthony Watts inspecteren hoe de overige meetstations erbij staan, en het was niet veel beter gesteld met de meeste meetstations.
Het is in principe theoretisch mogelijk te compenseren voor het urban heat island, maar waarom het risico nemen? De IPCC blijkt het UHI effect sterk te onderschatten.
Tsja, en dan kom je opeens uit op enorm steile temperatuurstijgingen.
"
A paper by Chinese scientists, Ren, G., Zhou, Y., Chu, Z., Zhou, J., Zhang, A., Guo, J. and Liu, X. (2008) Urbanization effects on observed surface air temperature trends in north China. Journal of Climate 21: 1333-1348, has now shown conclusively that the IPCC's claim that the UHI is negligible is false. Ren et al did the obvious thing to check for the UHI effect: compare trends from rural stations with those from urban ones. They found that the trend (degrees C per decade) was 0.18 for rural stations, 0.25 in small cities and 0.34 in large cities, with an overall trend of 0.29. They estimate that the UHI effect is responsible for a trend of about 0.11 degrees per decade in China; that is almost 20 times as great as the IPCC's claim.
"
De temperatuurvariaties van de afgelopen eeuw zijn volledig te verklaren met natuurlijke variatie.
De aarde heeft natuurlijk een thermische traagheid, daarom zullen de temperaturen naijlen. Nog even geduld, een mini-ijstijd is aangekondigd voor 2040.
Environmentalism and its most extreme version, global warming alarmism, asks for an almost unprecedented expansion of government intrusion and intervention into our lives and of government control over us.
Václav Klaus
Václav Klaus
Het heet niet voor niets "Historical Climatology Network".quote:
Hierbij een andere kijk op de zaak:
https://sites.google.com/site/globalwarmingquestions/ar4uhi
Anthony Watts (van wattsupwiththat.com) constateerde dat een meetstation bij hem in de buurt onbetrouwbare data zou opleveren voor klimaatonderzoek. Dit werd genegeerd door de NOAA. Nieuwsgierig geworden ging Anthony Watts inspecteren hoe de overige meetstations erbij staan, en het was niet veel beter gesteld met de meeste meetstations.
Het is in principe theoretisch mogelijk te compenseren voor het urban heat island, maar waarom het risico nemen? De IPCC blijkt het UHI effect sterk te onderschatten.
Tsja, en dan kom je opeens uit op enorm steile temperatuurstijgingen.
Als je overstapt op een station 10 km verder, dan heb je misschien een betere lokatie, maar dan moet je correcties gaan toepassen om de verplaatsing in rekening te brengen. Je kan niet alle stations tegelijk veranderen want dan heb je twee temperature records die je niet met elkaar kan verbinden.
Dat station dat getoond wordt is blijkbaar USC00045385 lat=39.1458 lon=-121.5853 (de layout die ik op google earth zie komt overeen). Laatste data is van 2007, binnen een straal van 50 km liggen of lagen 82 andere stations, een twintigtal zijn vandaag operationeel.
Het "goede" station waarvan men een foto toont is USC00046506 39.7458 -122.1997 CA ORLAND (ligt op 83 km van USC00045385)
https://www.ipcc.ch/publi(...)/en/ch3s3-2-2-2.htmlquote:"
A paper by Chinese scientists, Ren, G., Zhou, Y., Chu, Z., Zhou, J., Zhang, A., Guo, J. and Liu, X. (2008) Urbanization effects on observed surface air temperature trends in north China. Journal of Climate 21: 1333-1348, has now shown conclusively that the IPCC's claim that the UHI is negligible is false. Ren et al did the obvious thing to check for the UHI effect: compare trends from rural stations with those from urban ones. They found that the trend (degrees C per decade) was 0.18 for rural stations, 0.25 in small cities and 0.34 in large cities, with an overall trend of 0.29. They estimate that the UHI effect is responsible for a trend of about 0.11 degrees per decade in China; that is almost 20 times as great as the IPCC's claim.
Ben benieuwd wanneer de volgende elfstedentocht plaatsvindt.quote:De temperatuurvariaties van de afgelopen eeuw zijn volledig te verklaren met natuurlijke variatie.
De aarde heeft natuurlijk een thermische traagheid, daarom zullen de temperaturen naijlen. Nog even geduld, een mini-ijstijd is aangekondigd voor 2040.
are we infinite or am I alone
Wanneer is de volgende elfstedentocht? Begin maar alvast met trainen.
http://www.climatedepot.c(...)ice-age-has-started/
http://www.climatedepot.c(...)ice-age-has-started/
Environmentalism and its most extreme version, global warming alarmism, asks for an almost unprecedented expansion of government intrusion and intervention into our lives and of government control over us.
Václav Klaus
Václav Klaus
Dus de IPCC modellen kloppen allemaal niet maar al het geneuzel in de marge wat het niet eens is met het IPCC en vage modellen maakt die moeten we allemaal voor waar aannemen terwijl daar nog minder overeenstemming in de modellen en uitkomsten is.quote:
Wanneer is de volgende elfstedentocht? Begin maar alvast met trainen.
http://www.climatedepot.c(...)ice-age-has-started/
En als bij het IPCC de modellen niet kloppen, dan worden gewoon de metingen aangepast. "Wil nog er iemand een hockeystick?"quote:
[..]
Dus de IPCC modellen kloppen allemaal niet maar al het geneuzel in de marge wat het niet eens is met het IPCC en vage modellen maakt die moeten we allemaal voor waar aannemen terwijl daar nog minder overeenstemming in de modellen en uitkomsten is.
Weten wat men weet en weten wat men niet weet: dat is kennis - Confucius
Hier is een voorbeeld van een (geringe) klimaatverandering door de mensheid:
http://notrickszone.com/#sthash.VRDthBy1.dpbs
Roet op ijs zorgt voor lokale opwarming. Komt ook van open haarden en bosbranden.
De modellen hadden deze bijdrage niet inbegrepen, dus werd het effect toegeschreven aan CO2.
http://notrickszone.com/#sthash.VRDthBy1.dpbs
Roet op ijs zorgt voor lokale opwarming. Komt ook van open haarden en bosbranden.
De modellen hadden deze bijdrage niet inbegrepen, dus werd het effect toegeschreven aan CO2.
Environmentalism and its most extreme version, global warming alarmism, asks for an almost unprecedented expansion of government intrusion and intervention into our lives and of government control over us.
Václav Klaus
Václav Klaus
beweer je hier nu dat het IPCC metingen hebben aangepast om de statische foute hockeystick maar te blijven laten kloppen de afgelopen 10 jaar.quote:
[..]
En als bij het IPCC de modellen niet kloppen, dan worden gewoon de metingen aangepast. "Wil nog er iemand een hockeystick?"
De hockeystick is voor zover ik weet gewoon aangepast na het commentaar van mcintyre.
Ik zie het probleem niet, het is zijn persoonlijke website, niet de site van het KMI of een andere officiële instantie. Trouwens:quote:
Ook temperatuurhomogenisaties (foezelen?) in België:
http://klimaatgek.nl/word(...)sche-dagen-in-ukkel/
klimaatgek: Begrijp ik het goed: heeft weerman Frank hier eigenhandig een homogenisatie toegepast?
klimaatgek: "Ik heb zelf als proef een homogenisatie gedaan."
Dat het geen "professionele" homogenisatie is lijkt Deboosere zelf toe te geven: "Ik heb voor de berekening van de tropische dagen (ook wel hittedagen genoemd) al de nodige correctiefactoren proberen toe te passen."
Ik heb een grafiek van de raw data gemaakt
SPOILEROm spoilers te kunnen lezen moet je zijn ingelogd. Je moet je daarvoor eerst gratis Registreren. Ook kun je spoilers niet lezen als je een ban hebt.Maar viel me nadien op dat er veel data ontbreekt in de GHCN file. Lijkt rond 2000 te beginnen, en het aantal missing values (-9999) stijgt naarmate de data recenter wordt, van sporadische gaten in 2000 tot een periode van 8 maand zonder één enkele maximum temperatuur in 2015.
Dit is bvb het temperatuuroverzicht van juli 2001 (waarden zijn tienden van een graad celcius) :
1
2BE000006447200107TMAX 242 S 227 S 275 S 300 S 310 S-9999 -9999 -9999 202 S 228 S 204 S-9999 194 S 150 S 204 S 198 S 226 S 179 S 178 S 186 S 202 S 256 S 238 S 259 S 263 S 281 S 298 S 266 S 273 S 294 S 253 S
BE000006447200107TMIN 129 S 142 S 152 S 163 S-9999 -9999 -9999 152 S 128 S-9999 -9999 120 S 112 S-9999 98 S 106 S 112 S 133 S 138 S 125 S 114 S 158 S-9999 153 S 149 S 175 S 170 S 185 S 152 S 178 S-9999
november 2012Tmin voor april tot juni 2015:
1
2BE000006447201211TMAX 112 S-9999 98 S 104 S-9999 108 S 122 S 103 S 120 S 122 S 97 S-9999 95 S 122 S 54 S 58 S-9999 -9999 105 S 125 S-9999 115 S 83 S-9999 -9999 123 S-9999 78 S 68 S-9999 -9999
BE000006447201211TMIN-9999 -9999 42 S 41 S-9999 14 S 69 S-9999 -9999 76 S-9999 -9999 62 S-9999 -9999 -9999 22 S-9999 -9999 -9999 40 S 57 S 57 S 76 S-9999 60 S-9999 -9999 -9999 -9999 -9999Was misschien voorspelbaar, het is een "historical" database met real-time daily updates, dan is de eerste prioriteit het ontvangen van de daily updates, niet het bijwerken van oude data. Zeker niet als je geen onderscheid kan maken tussen ontbrekende en onbestaande data, je kan moeilijk voor elke ontbrekende waarde contact opnemen met het meetstation in kwestie, dan heb je een call-center (of mail-center) nodig.
1
2
3BE000006447201504TMIN-9999 -9999 -9999 -9999 -9999 -9999 -9999 -9999 -9999 -9999 -9999 -9999 -9999 -9999 -9999 -9999 70 S 36 S 39 S-9999 -9999 -9999 -9999 -9999 -9999 -9999 -9999 -9999 -9999 -9999 -9999
BE000006447201505TMIN-9999 -9999 -9999 -9999 -9999 -9999 -9999 -9999 -9999 -9999 -9999 -9999 71 S-9999 -9999 -9999 -9999 -9999 -9999 59 S 49 S-9999 -9999 -9999 -9999 51 S-9999 -9999 -9999 -9999 -9999
BE000006447201506TMIN-9999 -9999 -9999 -9999 -9999 -9999 -9999 -9999 -9999 -9999 -9999 -9999 -9999 -9999 -9999 -9999 -9999 -9999 104 S 107 S 132 S-9999 -9999 -9999 132 S 153 S 159 S 116 S-9999 -9999 -9999
Ukkel (BE000006447) is recordhouder in de GHCND database, heeft de langste ononderbroken datareeks, van 1833 (twee jaar na het ontstaan van België) tot nu. Maar het is het enige Belgische meetstation in de database (tegenover 358 Nederlandse...).are we infinite or am I alone
Ik kwam dit artikel tegen, moest eigenlijk meteen aan dit topic denken.
quote:How To Lie With Numbers
Kevin Gray
Marketing Science and Analytics
It takes less effort to lie without numbers, but there are now more numbers and more ways to lie with them than ever before. Poor Reverend Bayes, who understood the true meaning of "evidence".
This is a Golden Era for the huckster. Here are some of the many tricks you can use if you're one of them. Few are very difficult, and all you really need is no ethics.
1.Your pitch will be more convincing if it has numbers. If you don't have any numbers, just make some up. Rankings, for example, impress many people and are easy as pie to fabricate. Just arbitrarily select some criteria and subjectively weight each criterion. Claim the weights were determined by AI. Then get your friends to score the companies or whatever it is you’re ranking on the same criteria. Sum the weighted scores and, Bingo, you have expert judgements! By adjusting the weights, you can get any ranking you want.
2.People respond inconsistently to logic and evidence. Use emotional appeals, sprinkled with numbers that appear to support your case.
3.When making the case that there is a need for whatever it is you're selling, generalize from the exception. Make rare events seem more commonplace than they really are. Good way to drum up VC money.
4.Deliberately confuse potential with reality. Sure, your gizmo might one day serve a real need, but it has no track record yet. Use projected trends from official sources as smoke screens to make it seem like it is serving a real need NOW. It doesn't matter if these trends are relevant to what you are selling. "By 2025, there will be XXXX billion connected devices!" works just about every time for just about anything.
5.Build your sales pitch around the few cases when whatever it is you're pitching did work. Showcase these, and make sure not to mention the dozens of times it flopped.
6.Construct your argument so that anyone who questions it is made to seem ignorant, stupid or naïve. Numbers can really come in handy here, especially when they are bogus.
7.Establish your lies as the truth through constant repetition.
8.You can be confident that few people will scrutinize your claims. Only a handful will remember all the predictions you made in the past that turned out to be wrong. If they do, revise your predictions so that they appear to have been accurate.
9.Recall that few journalists have had much training in statistics or have deep knowledge of the subjects they report on. They also have convenient memories about what they have reported in the past.
10.Understand that people will believe you if they want to believe you. The trick is to make them want to believe you.
11.When your method or technology has been shown not to work, cite "new research" as vindicating it: "You shouldn't have believed me then, but you can believe me now. Trust me." in different words.
12.When your method or technology has been shown not to work, make the false claim that "No one does that anymore.That's the old way." to discredit your critics and wiggle out of the jam.
13.Complain about "hype about hype."
14.Conversely, admit there's been a lot of hype about what you're selling. Sound exasperated. Then rephrase the hype.
15.Cite discredited research.
16.Cite discredited research as discrediting the research that discredits your research.
17.Cite experts. Lots of them. It doesn’t matter if their views actually support your position. Throw in some famous authorities and some people no one has heard of. This will make you look like an authority yourself, intimidate your critics and make them waste their time looking up your citations. Avoid citing books that are freely downloadable and papers that aren’t paywalled.
18.Cite the handful of experts who happen to agree with you and claim their views are what nearly all experts on the subject believe.
19.Misrepresent the views of experts or quote them out of context, as needed.
20.Distort your critics' case. Straw men dot the landscape these days, but there's always room for one more.
21.Quote academics who have a commercial interest in your claims. Accuse your critics of having an “agenda” or financial conflicts of interest to conceal your own agenda and financial conflicts of interest.
22.Deliberately confuse theory with evidence.
23.Use lots of jargon. Use words like "Bayesian" and "Meta-Analysis" that are now fashionable but misunderstood by most people "Disruptive" may have seen its day but can still come in handy. No need to define what it means.
24.When you've been exposed, respond with long, complicated rebuttals that appear authoritative but are hard for laypersons to see through. You don't have to say much of substance. Make your opponents seem like dummies who just doesn't get it.
25.Simple arguments are often effective. However, many people are impressed by things they don't understand. Depending on the audience and what you're pushing, either oversimplifying or mystifying may be the better tactic.
26.Cherry pick research that supports your argument. This is most effective when no one has attempted to reproduce or replicate this research.
27.Cherry pick data. Include or exclude variables as needed.
28."Adjust" data so that it supports your claim. Use percentages creatively, for example saying that your sophisticated targeting increased conversion by 50% when the actual increase was from 0.001 to 0.0015.
29.To "prove" that your gizmo can accurately predict sales, for example, retrospectively mine data and only mention the hits, never the misses. Make it seem like you made these "predictions" before the fact, not after. Who will know?
30.Simulate data and pass it off as actual data.
31.Use simulations programmed with the assumptions you're trying to prove as proof these assumptions are true.
32.Cherry pick models. Model the data until it confesses!
33.Deliberately reverse cause and effect.
34.Use new and unproven methods but sell them as cutting edge. Or, use old methods with a new name you've made up. Better yet, call anything AI!
35.Use data visualization to exaggerate small differences or to conceal things you need to hide.
36.Only cite part of a data series - ideally just two points in time - that are consistent with your claim.
37.Quote numbers and research out of context. Quote selectively from research.
38.Humans have a strong tendency to think in black and white terms. Use this to your advantage. For example, make it seem like anyone who questions your “innovation” is a dinosaur.
39.When backed into a corner and in risk of being exposed, use misdirection. Fire back with data or arguments that are entirely irrelevant in order to confuse and distract your opponents.
40.Humans often see patterns in randomness. Use this to your advantage.
41.Many people mistakenly believe random means even. Use this to your advantage.
42.Make creative use of benchmarks. For example, present bad performance as if it were standard performance. Concentrate on failure and don't mention the majority of cases when current practice or technology works just fine.
43.When you can't rebut an opponent's argument, resort to ad hominem tactics.
44.Set the bar impossibly high for your opponents and conveniently low your yourself.
45.Use statistical significance to your advantage, for example when effect sizes are small but sample sizes are large.
46.People want to believe in miracles, so claim you can do what no one else can do. Conceal the details of what you actually do and that it doesn't work.
47.Distort criticisms of statistics or use them out of place. For example, don't let on that the normal distribution is but one of dozens used by statisticians.
48.If your critics make a trivial error - even an innocent typo - use that to discredit their entire case.
49.Play Whack-A-Mole with your critics. When they hammer a point you’ve made, respond swiftly with another, unrelated remark. When they hammer that one, quickly respond with a different argument that is unconnected to the first two. Keep popping up randomly all over the place. This is one way to confuse and wear down your opponents, especially those who think logically and play fair.
50.If someone completely demolishes your position with logic and evidence, perhaps your best option is to forget everything I've said and simply ignore them.
There are many tricks that can be used to deceive us. Please be on the lookout!!
WEB / [HaxBall #64] Jos is God
Arguing on the Internet is like running in the Special Olympics.
Arguing on the Internet is like running in the Special Olympics.
De DWD schreef:quote:
Nog maar eens even de link goed lezen, de Duitse KNMI schetst een rampenscenario met enorme overstromingen.
Een ander instituut, de EIKE, heeft hier een heel ander beeld bij.
De timing is wel opvallend, vlak voor de top in Hamburg nog even een sfeer proberen te scheppen om knopen door te hakken, en de miljarden toe te kennen voor het te laat is.
Ze verwijzen dus naar de G20 landen. Dat kan je opvallend vinden, net voor de G20 top...quote:„Der Meeresspiegelanstieg wird Folgen für Küstenmetropolen in G20-Staaten haben. Er bringt erhebliche Risiken für Wohn- und Lebensraum von hunderten Millionen von Menschen. Bauten und Infrastrukturen im Wert von Billionen US-Dollar sind unmittelbar durch den Anstieg des Meeresspiegels bedroht. Die heutigen Emissionen lassen langfristig weite Küstenstreifen unter dem Meeresspiegel liegen. Die Dringlichkeit erfordert ernsthaften Umgang mit Fakten. Schon jetzt sind irreversible Änderungen von Klimaprozessen in allen Regionen der Welt sichtbar. Es sind gemeinsame Maßnahmen aller Staaten auf globaler Ebene zum Schutz des Klimas unumgänglich.“
EIKE (een instituut met als slogan "niet het klimaat wordt bedreigd, maar onze vrijheid") reageert met: dat klopt niet, want in Cruxhaven ...
Dat is vergelijkbaar met: "Europa heeft geen last van terrorisme want er zijn in Nederland geen aanslagen gepleegd".
Ik vind het argument van de DWD trouwens vrij zwak, lijkt me dat de landen van de G20 genoeg geld (zullen) hebben om zich tegen de stijging te beschermen (Japan is/was van plan een 10 meter hoge tsunamibarriere te bouwen, in vergelijking daarmee is een stijging van 0.5 of 1 meter peanuts).
Wat betreft "de miljarden toe te kennen voor het te laat is", als je voor klimaatonderzoek bedoelt, daar zouden skeptics de grootste voorstanders van moeten zijn. Vond jij niet dat er veel te weinig meetstations in Afrika waren? Je wilde ook meer metingen op zee, en de lokaties van de huidige meetstations op land deugt niet dus die moeten verplaatst worden. Misschien nog een duizendtal vliegtuigen die 24/24 de luchttemperatuur op verschillende hoogtes meten. Die kunnen ook luchtmonsters nemen, iemand twijfelde aan de nauwkeurigheid van de CO2 metingen...
are we infinite or am I alone
En toen kwam de marcott wheelchairquote:
[..]
beweer je hier nu dat het IPCC metingen hebben aangepast om de statische foute hockeystick maar te blijven laten kloppen de afgelopen 10 jaar.
De hockeystick is voor zover ik weet gewoon aangepast na het commentaar van mcintyre.

Weten wat men weet en weten wat men niet weet: dat is kennis - Confucius
quote:
[..]
En toen kwam de marcott wheelchair
[ afbeelding ]
[ Bericht 12% gewijzigd door -jos- op 27-07-2017 04:48:04 ]
WEB / [HaxBall #64] Jos is God
Arguing on the Internet is like running in the Special Olympics.
Arguing on the Internet is like running in the Special Olympics.
| Forum Opties | |
|---|---|
| Forumhop: | |
| Hop naar: | |