Het is dus niet de bedoeling om hier een discussie te gaan houden of TA wel of niet werkt.
Introductie
Trends, support/resistance en chart patternsquote:What is Technical Analysis (TA)?
Technical analysis is the study of historical market data, including price and volume. Using insights from market psychology, behavioral economics, and quantitative analysis, technical analysts aim to use past performance to predict future market behavior. The two most common forms of technical analysis are chart patterns and technical (statistical) indicators.
What does Technical Analysis tell you?
Technical analysis is a blanket term for a variety of strategies that depend on interpretation of price action in a stock. Most technical analysis is focused on determining whether or not a current trend will continue and, if not, when it will reverse. Some technical analysts swear by trendlines, others use candlestick formations, and yet others prefer bands and boxes created through a mathematical visualization. Most technical analysts use some combination of tools to recognize potential entry and exit points for trades. A chart formation may indicate an entry point for a short seller, for example, but the trader will look at moving averages for different time periods to confirm that a breakdown is likely.
Limitations of Technical Analysis
Technical analysis has the same limitation of any strategy based on particular trade triggers. The chart can be misinterpreted. The formation may be predicated on low volume. The periods being used for the moving averages may be too long or too short for the type of trade you are looking to make. Leaving those aside, the technical analysis of stocks and trends has a fascinating limitation unique to itself.
Technical analysis has the same limitation of any strategy based on particular trade triggers. The chart can be misinterpreted. The formation may be predicated on low volume. The periods being used for the moving averages may be too long or too short for the type of trade you are looking to make. Leaving those aside, the technical analysis of stocks and trends has a fascinating limitation unique to itself.
The difference between Technical Analysis and Fundamental Analysis
Fundamental analysis and technical analysis are the two big factions in finance. Whereas technical analysts believe the best approach is to follow the trend as it forms through market action, fundamental analysts believe the market often overlooks value. Fundamental analysts will ignore chart trends in favor of digging through the balance sheet and the market profile of a company in search of intrinsic value not currently reflected in the price. There are many examples of successful investors using fundamental or technical analysis to guide their trading and even those who incorporate elements of both. On the whole, however, technical analysis lends itself to a faster investing pace, whereas fundamental analysis generally has a longer decision timeline and holding period by virtue of the time required for the extra due diligence.
Bron: Investopedia
Websitesquote:Trends: Uptrend (bullish), downtrend (bearish) or oscillating
Support is the price level at which demand is thought to be strong enough to prevent the price from declining further. The logic dictates that as the price declines towards support and gets cheaper, buyers become more inclined to buy and sellers become less inclined to sell. By the time the price reaches the support level, it is believed that demand will overcome supply and prevent the price from falling below support.
Resistance is the price level at which selling is thought to be strong enough to prevent the price from rising further. The logic dictates that, as the price advances towards resistance, sellers become more inclined to sell and buyers become less inclined to buy. By the time the price reaches the resistance level, it is believed that supply will overcome demand and prevent the price from rising above resistance.
Important chart patterns:Bron: IGSPOILERHead and shoulders
Head and shoulders is a chart pattern in which a large peak has a slightly smaller peak on either side of it. Traders look at head and shoulders patterns to predict a bullish-to-bearish reversal.
Typically, the first and third peak will be smaller than the second, but they will all fall back to the same level of support, otherwise known as the ‘neckline’. Once the third peak has fallen back to the level of support, it is likely that it will breakout into a bearish downtrend.
Double Top
A double top is another pattern that traders use to highlight trend reversals. Typically, an asset’s price will experience a peak, before retracing back to a level of support. It will then climb up once more before reversing back more permanently against the prevailing trend.
Double Bottom
A double bottom chart pattern indicates a period of selling, causing an asset’s price to drop below a level of support. It will then rise to a level of resistance, before dropping again. Finally, the trend will reverse and begin an upward motion as the market becomes more bullish.
A double bottom is a bullish reversal pattern, because it signifies the end of a downtrend and a shift towards an uptrend.
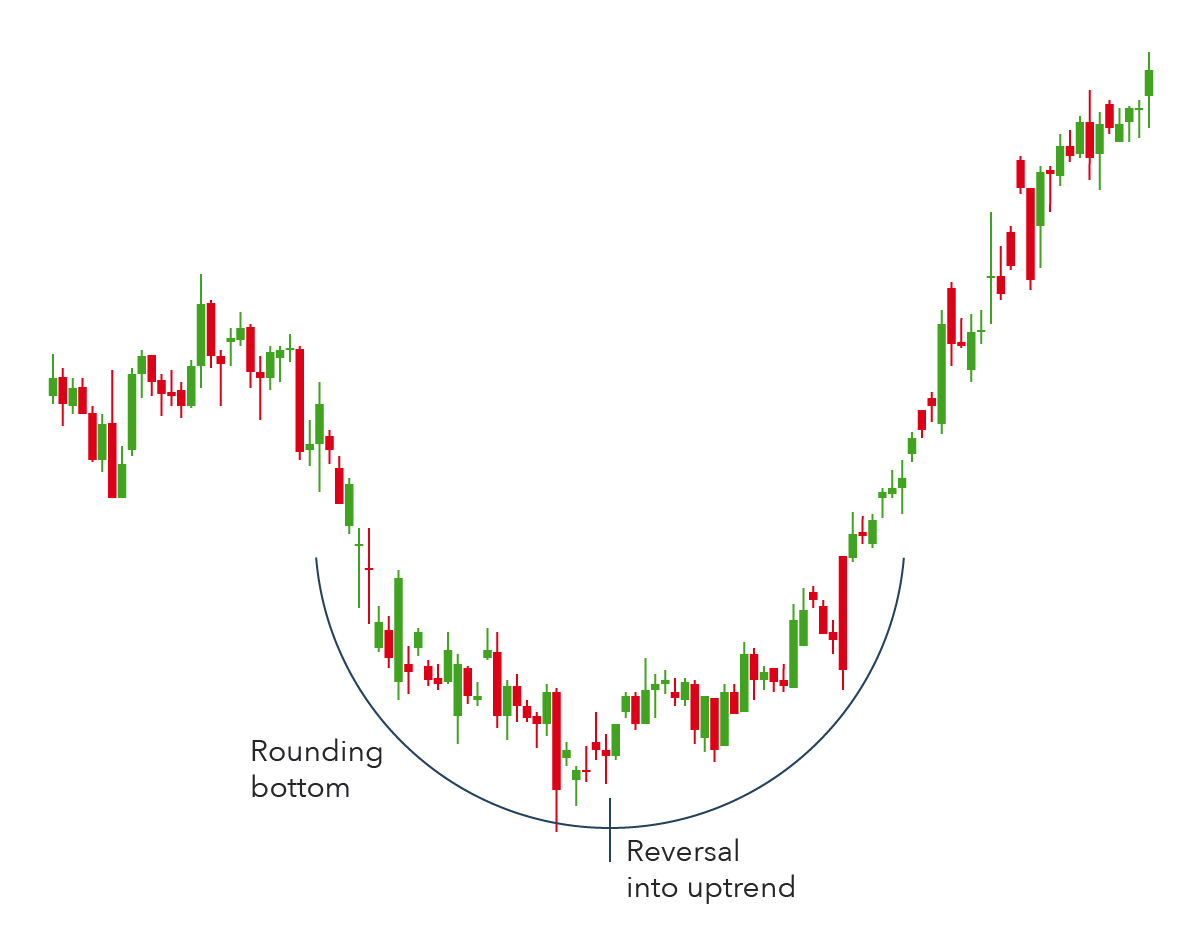
Rounding Bottom
A rounding bottom chart pattern can signify a continuation or a reversal. For instance, during an uptrend an asset’s price may fall back slightly before rising once more. This would be a bullish continuation.
An example of a bullish reversal rounding bottom – shown below – would be if an asset’s price was in a downward trend and a rounding bottom formed before the trend reversed and entered a bullish uptrend.
Cup and handle
The cup and handle pattern is a bullish continuation pattern that is used to show a period of bearish market sentiment before the overall trend finally continues in a bullish motion. The cup appears similar to a rounding bottom chart pattern, and the handle is similar to a wedge pattern – which is explained in the next section.
Following the rounding bottom, the price of an asset will likely enter a temporary retracement, which is known as the handle because this retracement is confined to two parallel lines on the price graph. The asset will eventually reverse out of the handle and continue with the overall bullish trend.
Wedges
Wedges form as an asset’s price movements tighten between two sloping trend lines. There are two types of wedge: rising and falling.
A rising wedge is represented by a trend line caught between two upwardly slanted lines of support and resistance. In this case the line of support is steeper than the resistance line. This pattern generally signals that an asset’s price will eventually decline more permanently – which is demonstrated when it breaks through the support level.
A falling wedge occurs between two downwardly sloping levels. In this case the line of resistance is steeper than the support. A falling wedge is usually indicative that an asset's price will rise and break through the level of resistance, as shown in the example below.
Both rising and falling wedges are reversal patterns, with rising wedges representing a bearish market and falling wedges being more typical of a bullish market.
Pennants (flags)
Pennant patterns, or flags, are created after an asset experiences a period of upward movement, followed by a consolidation. Generally, there will be a significant increase during the early stages of the trend, before it enters into a series of smaller upward and downward movements.
Pennants can be either bullish or bearish, and they can represent a continuation or a reversal. The above chart is an example of a bullish continuation. In this respect, pennants can be a form of bilateral pattern because they show either continuations or reversals.
While a pennant may seem similar to a wedge pattern or a triangle pattern - explained in the next sections - it is important to note that wedges are narrower than pennants or triangles. Also, wedges differ from pennants because a wedge is always ascending or descending, while a pennant is always horizontal.
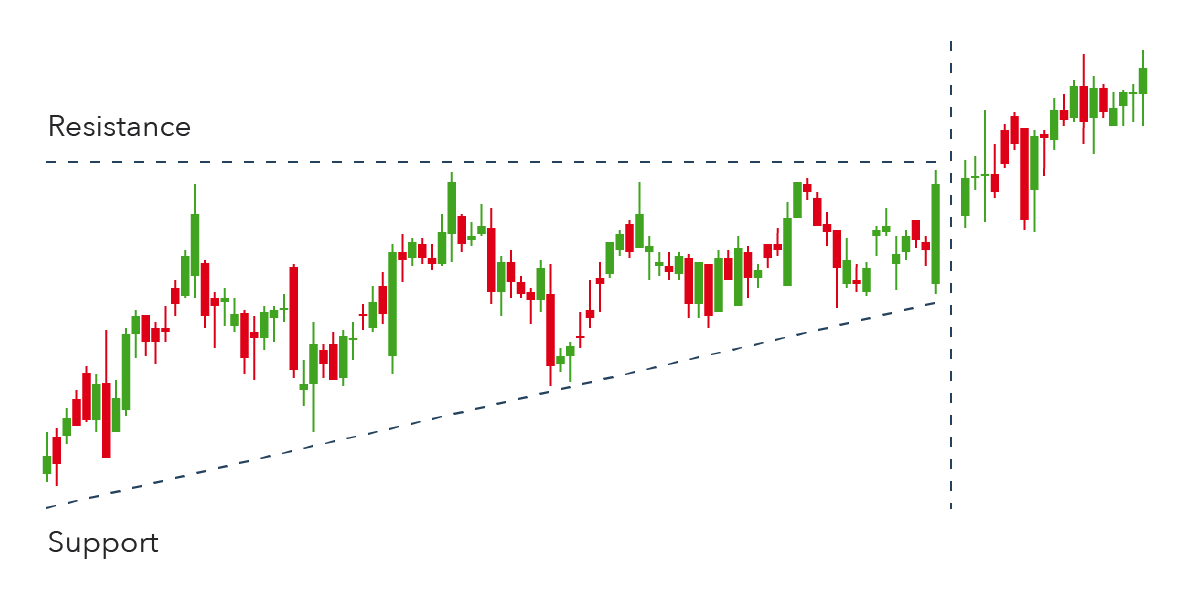
Ascending triangle
The ascending triangle is a bullish continuation pattern which signifies the continuation of an uptrend. Ascending triangles can be drawn onto charts by placing a horizontal line along the swing highs - the resistance - and then drawing an ascending trend line along the swing lows - the support.
Ascending triangles often have two or more identical peak highs which allow for the horizontal line to be drawn. The trend line signifies the overall uptrend of the pattern, while the horizontal line indicates the historic level of resistance for that particular asset.
Descending triangle
In contrast, a descending triangle signifies a bearish continuation of a downtrend. Typically, a trader will enter a short position during a descending triangle - possibly with CFDs - in an attempt to profit from a falling market.
Descending triangles generally shift lower and break through the support because they are indicative of a market dominated by sellers, meaning that successively lower peaks are likely to be prevalent and unlikely to reverse.
Descending triangles can be identified from a horizontal line of support and a downward-sloping line of resistance. Eventually, the trend will break through the support and the downtrend will continue.
Symmetrical triangle
The symmetrical triangle pattern can be either bullish or bearish, depending on the market. In either case, it is normally a continuation pattern, which means the market will usually continue in the same direction as the overall trend once the pattern has formed.
Symmetrical triangles form when the price converges with a series of lower peaks and higher troughs. In the example below, the overall trend is bearish, but the symmetrical triangle shows us that there has been a brief period of upward reversals.
However, if there is no clear trend before the triangle pattern forms, the market could break out in either direction. This makes symmetrical triangles a bilateral pattern - meaning they are best used in volatile markets where there is no clear indication of which way an asset's price might move. An example of a bilateral symmetrical triangle can be seen below.


Investopedia
Tradingview
Voor iedereen die zich wel wil verdiepen in de (on)mogelijkheden van TA is Study Guide to Technical Analysis of the Financial Markets van John J. Murphy een aanrader!
[ Bericht 11% gewijzigd door Evenstar op 17-01-2021 11:32:52 ]